

Translate this page into:
The association of embryo quality with the number of days of ovarian stimulation in women undergoing IVF/ICSI-ET cycle- a prospective observational study
Address for correspondence: Dr Divya Prasad, IFS Fellow, Flat no 43-D, L.I.G, DDA flats, Gulabibagh, New Delhi. E-mail: drdivyaprasad@rediffmail.com.
-
Received: ,
Accepted: ,
This is an open access journal, and articles are distributed under the terms of the Creative Commons Attribution-NonCommercial-ShareAlike 4.0 License, which allows others to remix, tweak, and build upon the work non-commercially, as long as appropriate credit is given and the new creations are licensed under the identical terms.
This article was originally published by Wolters Kluwer - Medknow and was migrated to Scientific Scholar after the change of Publisher.
Abstract
Objective:
An attempt was made to evaluate the impact of the length of ovarian stimulation on the embryo quality, with recommended strength of gonadotropin doses in women who underwent IVF/ICSI-ET cycles.
Setting:
Women, who underwent oocyte retrieval and fresh embryo transfer between August 2019 and November 2019, were evaluated.
Design:
Prospective observational study.
Method:
Women with primary and secondary infertility were recruited from the OPD. Ovarian stimulation was started with gonadotropins according to our center’s protocol (Antagonist protocol). Oocyte retrieval was performed approximately 36 hours after the hCG administration (trigger) followed by IVF/ICSI. Fertilization analysis was performed approximately 16 to 18 hours postinsemination. After fertilization, embryo scoring was carried out on the day of embryo transfer procedure. The primary outcome was the development of good quality embryos in relation to the days of ovarian stimulation.
Statistical Analysis:
Data were analyzed by Statistical Package for Social Studies (SPSS) 21.0 software package (IBM Corporation, USA): Chi-square test for categorical variables, nonparametric Kruskal Wallis test, ANOVA test, and Pearson correlation for continuous variables were applied. These tests were applied as appropriate and statistically significant level calculated at P < 0.05.
Results:
The length of ovarian stimulation has little impact on the quality of embryo and pregnancy outcome.
Conclusion:
The length of ovarian stimulation has little impact on the quality of embryo and pregnancy outcome. Future studies on large number with proper randomization are invited to be conducted to confirm the finding of present study.
Keywords
Gonadotropins
stimulation
embryo quality

INTRODUCTION
Infertility is the failure to conceive after 1 year of regular unprotected intercourse. Infertility is a common problem worldwide, affecting approximately up to 15% couples,[1] with varying rates in different parts of the world.[2,3] During the past three decades, IVF became the standard treatment for irreparable tubal disease, male factor infertility, endometriosis, cervical, and immunological factors as well as unexplained infertility unresponsive to IUI.[4] Various modalities of assisted reproductive technology (ART) like, in vitro fertilization/intra-cytoplasmic sperm injection-embryo transfer (IVF/ICSI-ET) provide opportunity for conception but the success rate is nearly 05% to 66%. The live birth rate was 55.9% with 18% twin births and 37.5% singleton births (Page 21 of 2013 National summary).[5]
The classic four steps of IVF treatment include ovarian stimulation with gonadotropins, the monitoring of follicular and endometrial development, oocyte harvesting, IVF of oocytes with sperms and embryo transfer. The soaring technological advances of microscopes, laboratory equipment, and culture media have allowed a real boom in the field of assisted reproduction. As with any new technique, possible risks such as short-term and long-term health consequences of the offspring must be considered.[6]
At present, with the advancement of ART, it is well understood that the most important factors for maximizing the success rate of IVF are retrieving greater number of good quality oocytes using controlled hyper-stimulation (COH) and establishing a receptive endometrium. Much effort has been made to understand the factors that affect IVF outcomes.[7,8] Perhaps the most important is ovarian ageing. Other factors known to affect assisted reproductive treatment outcomes include laboratory quality, the duration of infertility, and previous successful pregnancies. However, once a woman enters an ART program, none of these factors are readily modifiable.[9]
In contrast, factors that may be modifiable include the length of gonadotropin stimulation and the dosage of gonadotropins utilized. The length of the follicular phase is usually determined by the time it takes for the leading follicle to reach a predetermined size, that is 17 to 18 mm and may last anywhere between 06 and 20 days depending upon response to ovarian stimulation in women undergoing ART cycles.[9]
MATERIALS AND METHODS
This was a prospective observational study conducted in accordance with the Independent Ethics Committee. Thirty women with primary and secondary infertility and aged between 23 and 38 years with BMI (body weight divided by the square of body height) ranging between 19 and 29 kg/m2, from OPD at Matritava Advanced IVF and Training Centre, 29-Paschimi Marg, Block B, Vasant Vihar, New Delhi-110057, were included after taking informed written consent. As per our center’s protocol, the minimum duration of stimulation is 08 days and the maximum days of stimulation a women could receive is 11 days. Human chorionic gonadotropin (hCG) 10,000 IU was administered as trigger for final maturation when at least one or two follicles reached 17 to 18 mm or above. So, accordingly, all women were divided into four groups: Group A included those women who received 8 days of stimulation, Group B included those women who received 9 days of stimulation, Group C included those women who received 10 days of stimulation, and Group D included those women who received 11 days of stimulation. These groups were compared and evaluated for the demographic profile, doses of gonadotropins, number of oocytes retrieved, fertilization rate, grading of embryos, and clinical pregnancy outcome based on number of days of ovarian stimulation.
Women with previous poor response to ovarian stimulation, with relevant systemic disease (such as uncompensated heart disease, autoimmune disorders), severe endometriosis, or uterine or ovarian abnormalities were excluded. In woman with symptoms of mild to severe ovarian hyper-stimulation syndrome (OHSS), fresh Embryo transfer procedure was deferred.
The women were worked up for IVF cycles after general physical and local examinations that are routinely performed to rule out any abnormality (like ovarian cyst). The relevant investigations were performed after taking the history. Women underwent an initial transvaginal ultrasonography (TVS) examination to measure the baseline endometrial thickness and antral follicle count on day 2 of the menstrual cycle. Baseline endocrinal levels of serum FSH, serum LH, and serum progesterone (P4) were also measured simultaneously. Ovarian stimulation was started with gonadotropins according to our center’s protocol (Antagonist protocol cycle) for initial 5 days. Then on day 6, patient was called again for follicular monitoring. Follicular monitoring was done by TVS using a Voluson E-8 (GE Healthcare Austria GmbH & Co OG, Austria) at 7.5 Hz probe frequency. If the growth, based on the size of the follicles and endometrial thickness was adequate then same dose of gonadotropins will be continued. If the growth of the follicles was less then doses of gonadotropins were increased (stepped-up) until the follicles reached a size of 13 to 14 mm. When one or more follicles reach 14 mm in size, gonadotropin releasing hormone (GnRH) antagonist, (cetrorelix 0.25 mg), was introduced to avoid a premature LH surge. Human chorionic gonadotropin (hCG) 10,000 IU was administered as trigger for final maturation when at least one or two follicles reached 17 to 18 mm or above. Injection hCG was administered as trigger in all the women participating in this study. Oocyte retrieval was performed approximately 36 hours after the hCG administration (trigger) and progesterone supplementation was started. Subsequently, IVF or ICSI was performed depending upon husband’s semen parameters. Fertilization analysis was performed approximately 16 to 18 hours postinsemination. After fertilization, embryo scoring was carried out on the day of embryo transfer procedure. Embryo transfer was performed at cleavage stage or blastocyst stage under ultrasound guidance on day 3 or day 5 of embryo culture, respectively based on patient’s age, diagnosis, previous treatment success, and number and quality of embryos available for transfer.
Luteal support was provided as intramuscular administration of 100 mg micronized progesterone once a day or progesterone suppositories (200 mg) once a day were also started from the day of oocyte retrieval. Serum βhCG levels were measured after 2 weeks of embryo transfer. If, βhCG levels were found ≥ 50 IU/mL the pregnancy outcome was considered positive and βhCG levels was repeated after 48 hours in all women, including those in whom βhCG levels were found to be between 5 and 50 IU/mL, to evaluate the rise in the levels as double. These pregnancies were followed by a TVS examination between 6 and 7 weeks for the presence of fetal cardiac activity. The presence of fetal cardiac activity was considered as clinical pregnancy.
All women underwent controlled ovarian stimulation by standard antagonist protocol. The dose of the gonadotropins was adjusted according to the growth of the follicles and when one or more follicles reached 14 mm in size, a standard dose of GnRH antagonist, (cetrorelix 0.25 mg), was introduced to avoid a premature LH surge. All women were divided into four groups. These groups were compared and evaluated for the demographic profile, doses of gonadotropins, number of oocytes retrieved, fertilization rate, grading of embryos, and clinical pregnancy outcome based on number of days of ovarian stimulation.
A sample size of 120 was calculated as per 30% IVF success rate, 95% confidence level with 5% error, and 15% prevalence of infertility among the general population (Adequacy of Sample Size in Health Studies, Stanley Lemeshow &Stephen K. Lwanga et al.) and EPI-INFO Version 2.0. However, due to duration of the study and time constrains, a total of 30 women were enrolled as a sample of convenience in this study.[10]
Data were analyzed by Statistical Package for Social Studies (SPSS) 21.0 software package (IBM Corporation, USA): Chi-square test for categorical variables, nonparametric Kruskal Wallis test, ANOVA test, and Pearson correlation for continuous were applied. These tests were applied as appropriate and statistically significant level calculated at P < 0.05.
RESULTS
The distribution and comparison of age in different age groups, duration of infertility, type of infertility, religion, and various etiologies were made on the basis of number of days of ovarian stimulation among women who underwent IVF/ICSI-ET cycles. As described above, all women were divided into four groups: Group A included those women who received 8 days of stimulation, Group B included those women who received 9 days of stimulation, Group C included those women who received 10 days of stimulation, and Group D included those women who received 11 days of stimulation.
No significant difference was seen in the distribution of age (years) among the days of stimulation. The variable age (years) was normally distributed. It is shown in Table 1, Figure 1.

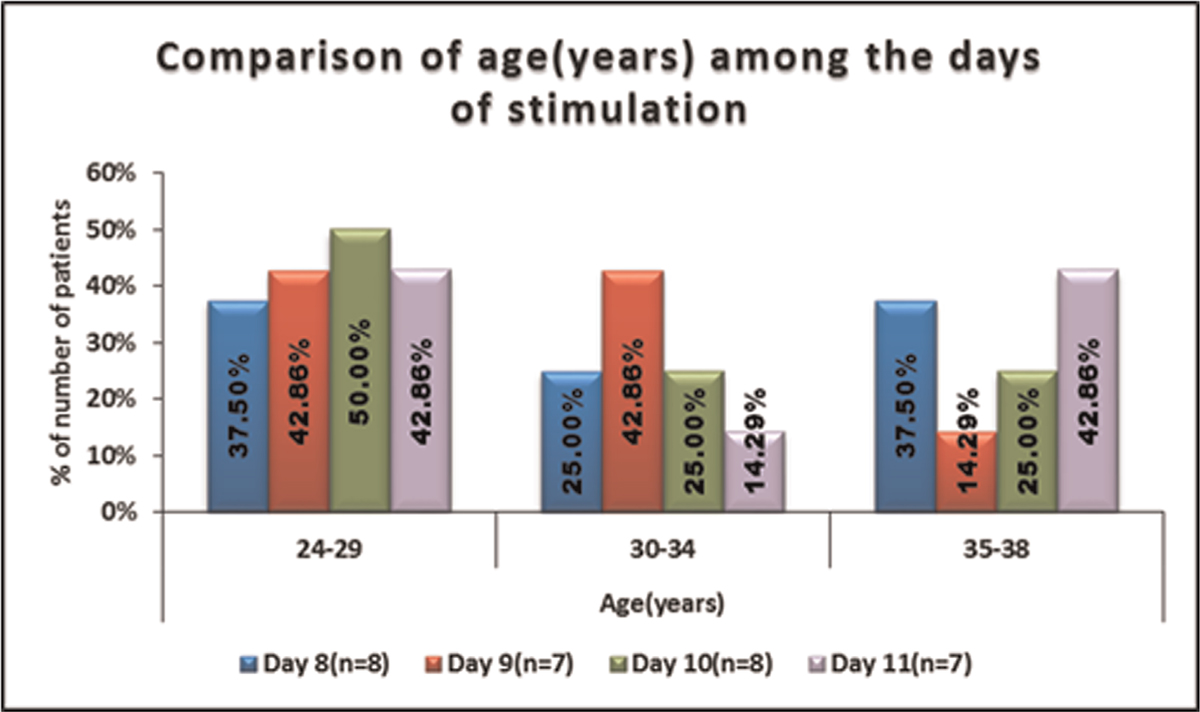
- -Comparison of age(years) among the days of stimulation.
No significant difference was seen in the distribution of type of infertility among the days of stimulation
It is shown in Table 2, Figure 2.

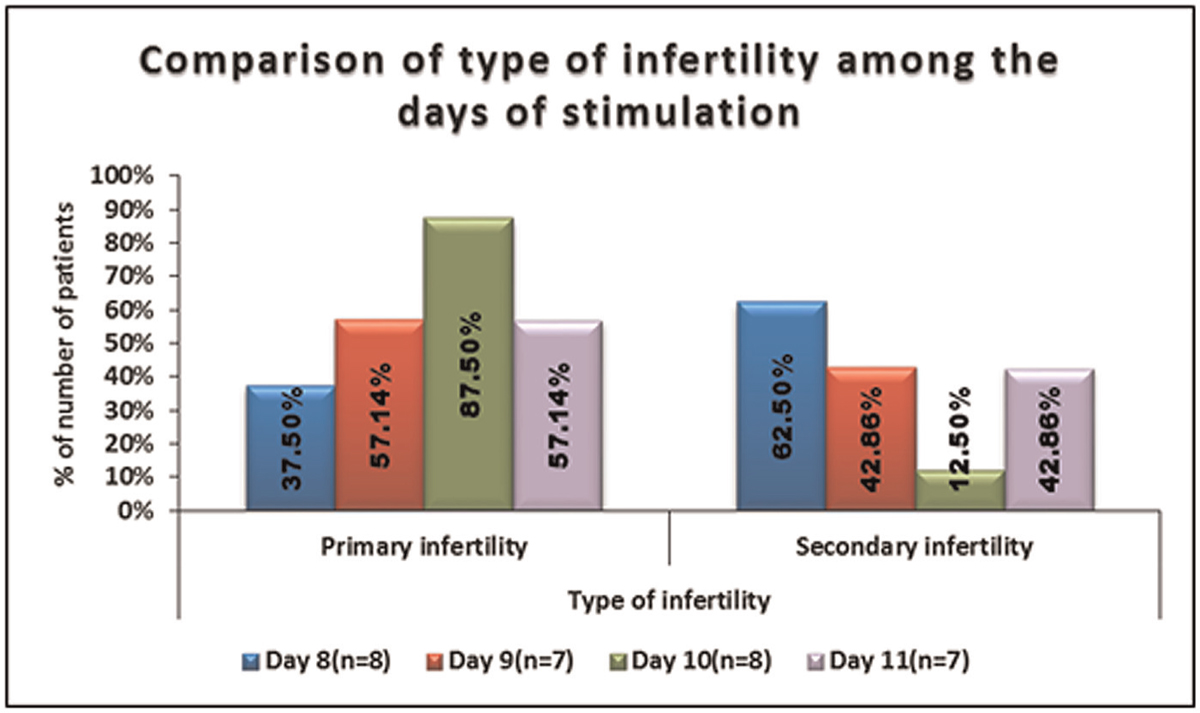
- -Comparison of type of infertility among the days of stimulation.
No significant difference was seen in the distribution of duration of infertility (years) among the days of stimulation. It is shown in Table 3, Figure 3.
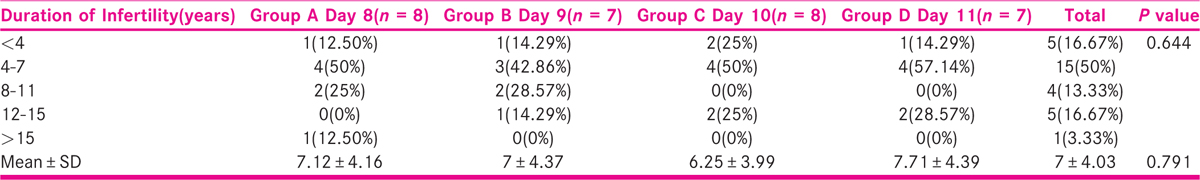

- -Comparison of duration of infertility(years) among the days of stimulation.
The variable total dose of gonadotropins was normally distributed. Thus parametric test was used for the comparison. Significant difference was seen in total dose of gonadotropins between days of stimulation. Total dose of gonadotropins in Group D was highest followed by Group C, Group B total dose of gonadotropins in Group A was lowest.
It is shown in Table 4, Figure 4.

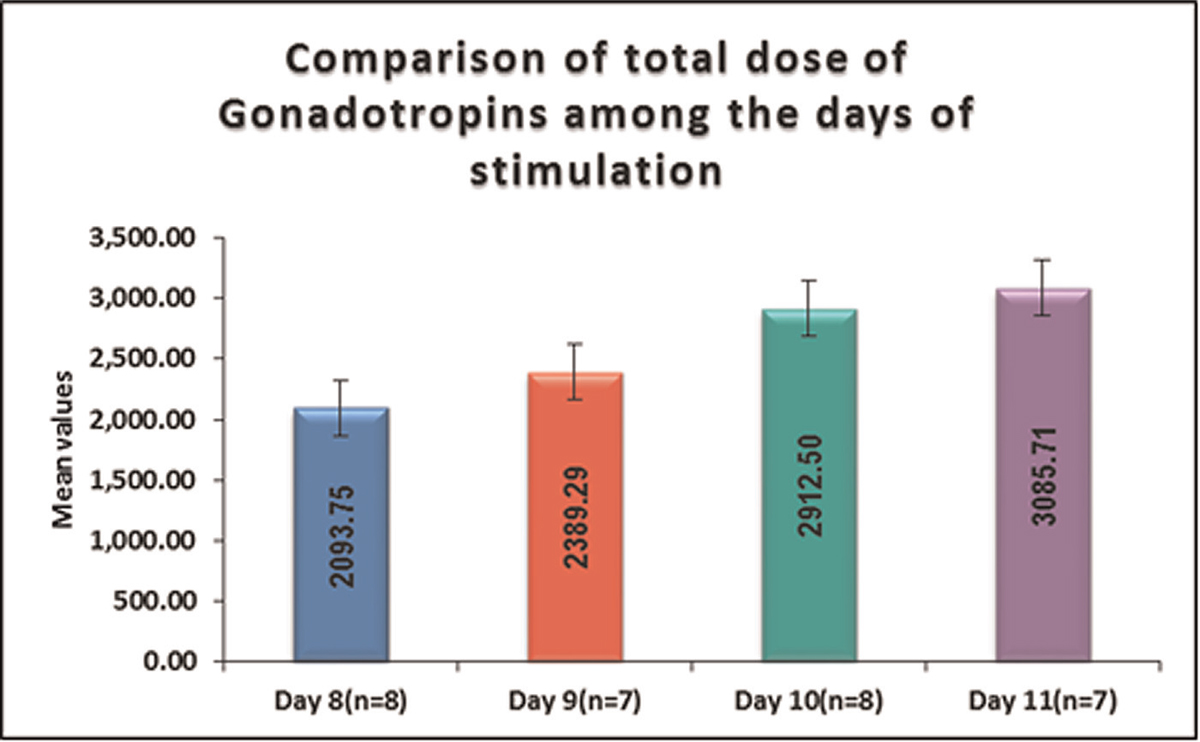
- -Comparison of total dose of gonadotropins among the days of stimulation. (parametric variables)
No significant difference was seen in peak estradiol level (pg/mL) between days of stimulation. It is shown in Table 5, Figure 5.


- - Comparison ofthe peak estradiol levels (pg/ml) among the days of stimulation. (parametric variables)
No significant difference was seen in AFC between days of stimulation. It is shown in Table 6, Figure 6.


- -Comparison of Antral Follicle Count (AFCs) among the days of stimulation. (parametric variables)
No significant difference was seen in the distribution of number of oocytes retrieved between days of stimulation. It is shown in Table 7, Figure 7.

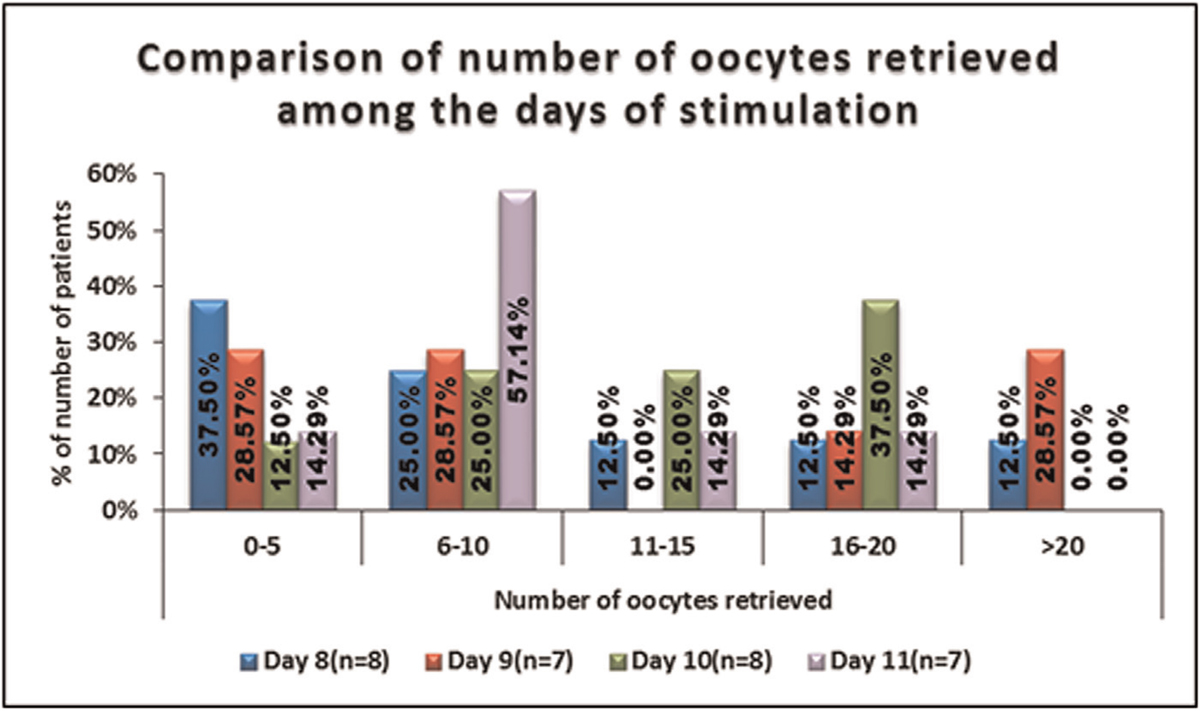
- -Comparison of the number of oocytes retrieved among the days of stimulation.
No significant difference was seen in the distribution of number of oocytes fertilized between days of stimulation. It is shown in Table 8, Figures 8 and 9.

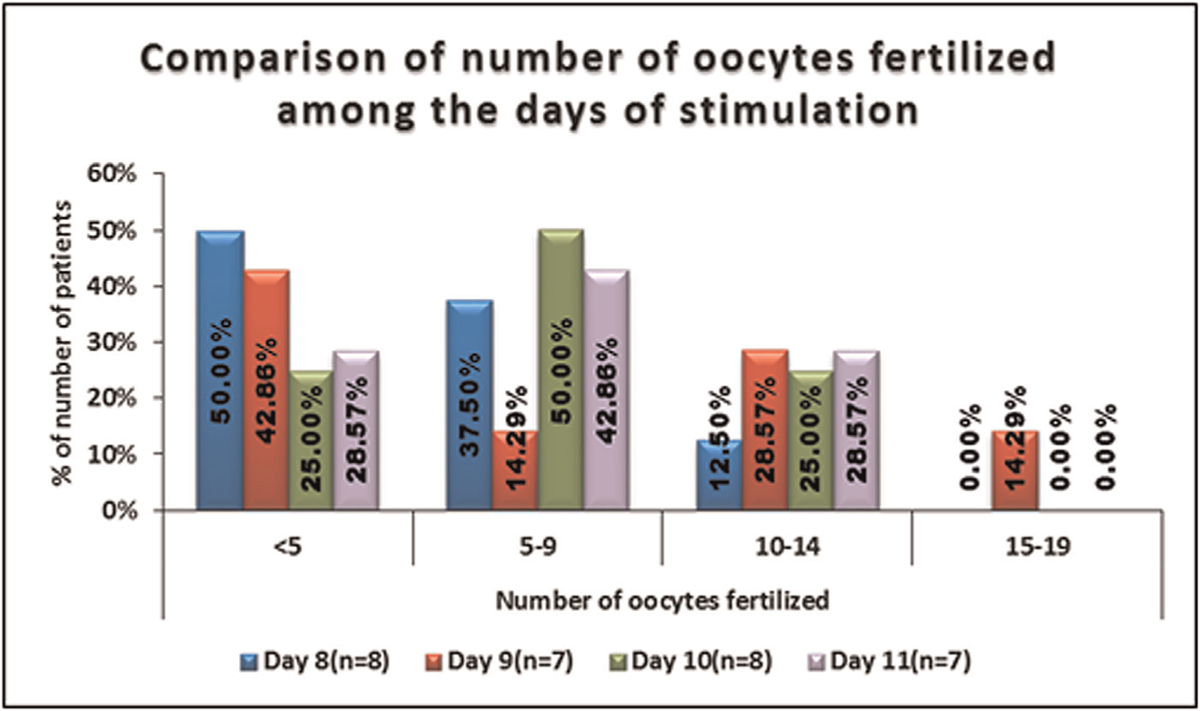
- -Comparison of the number of oocytes fertilized amongthe days of stimulation.
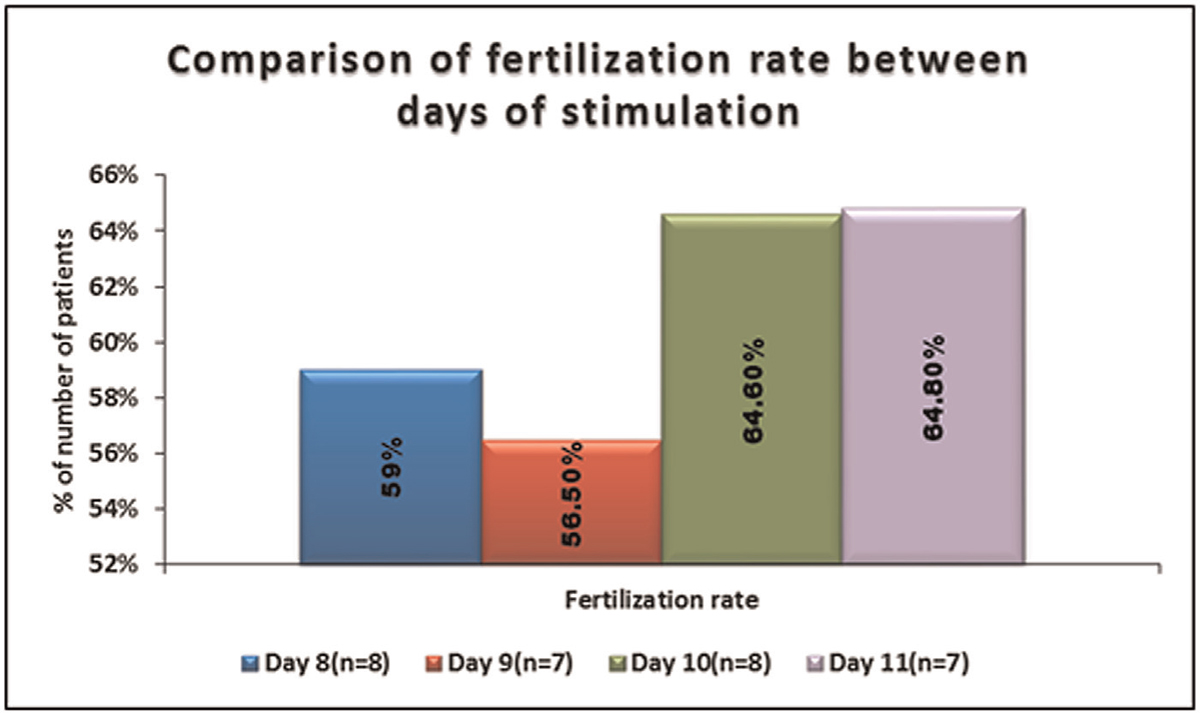
- -Comparison of fertilization rate between days of stimulation.
No significant difference was seen in the distribution of 6 to 8 CELL A1, 6-8 CELL A2, 4 CELL A1, 4 CELL A2, 4 CELL C1, 4 CELL B1, 4 CELL B2, 1 × 2 CELL B1, 4 CELL C2, and 2 CELL D1 between days of stimulation. It is shown in Table 9, Figure 10.

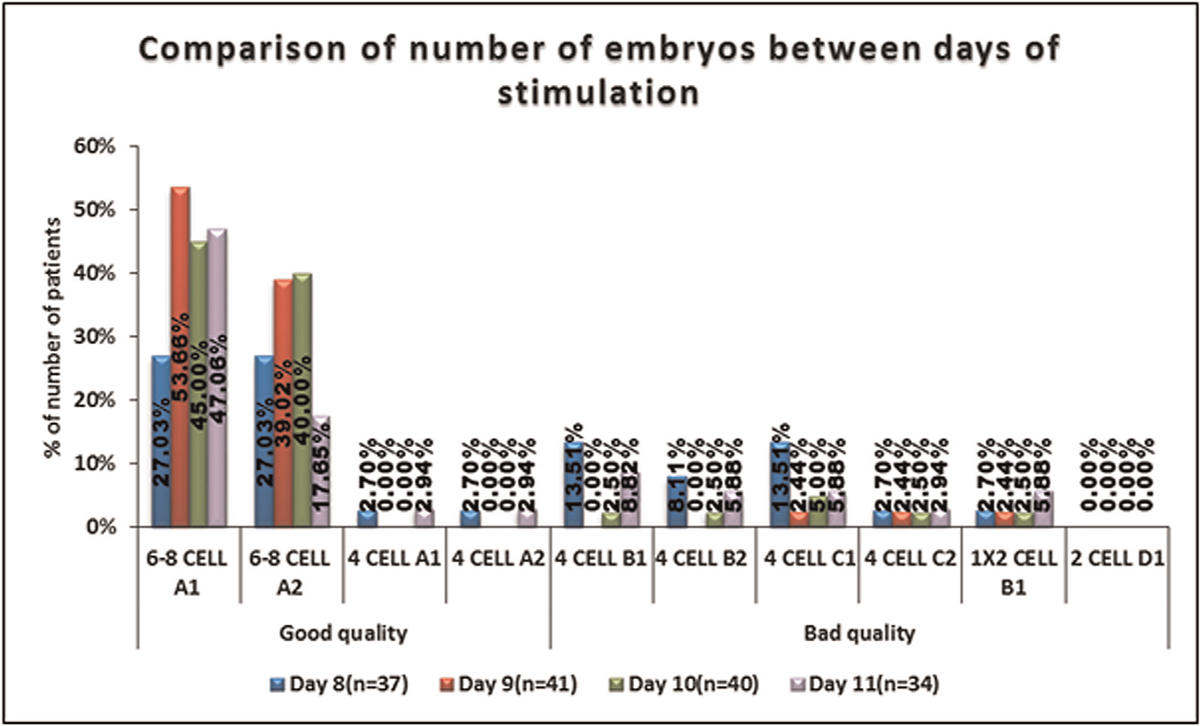
- -Comparison of the grading of the embryo among the days of stimulation.
No significant difference was seen in the distribution of number of embryo transferred among the days of stimulation.
No significant difference was seen in the distribution of quality of embryos among the days of stimulation.
It is shown in Table 10, Figure 11.


- -Comparison of the number of the embryos transferred amongthe days of stimulation.
No significant difference was seen in the distribution of embryo cryopreservation among the days of stimulation. It is shown in Table 11, Figure 12.

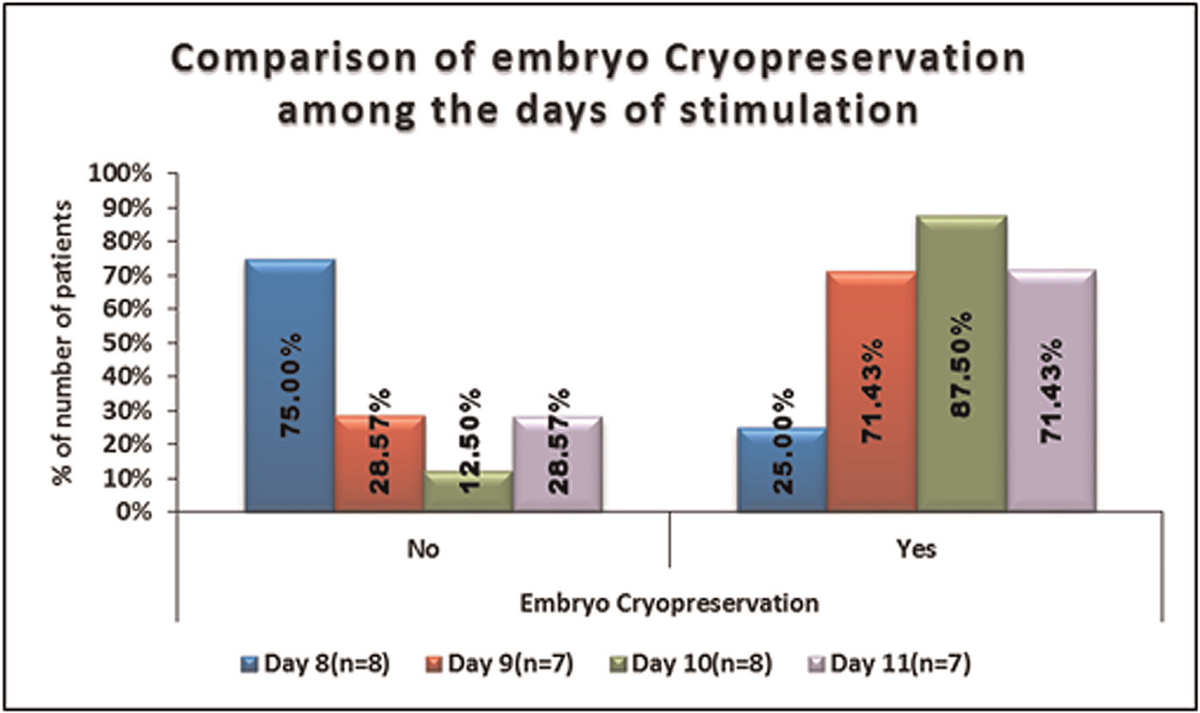
- -Comparison of the embryo cryopreservation among the days of stimulation.
No significant difference was seen in the distribution of number of embryo cryopreserved among the days of stimulation. It is shown in Table 12, Figure 13.

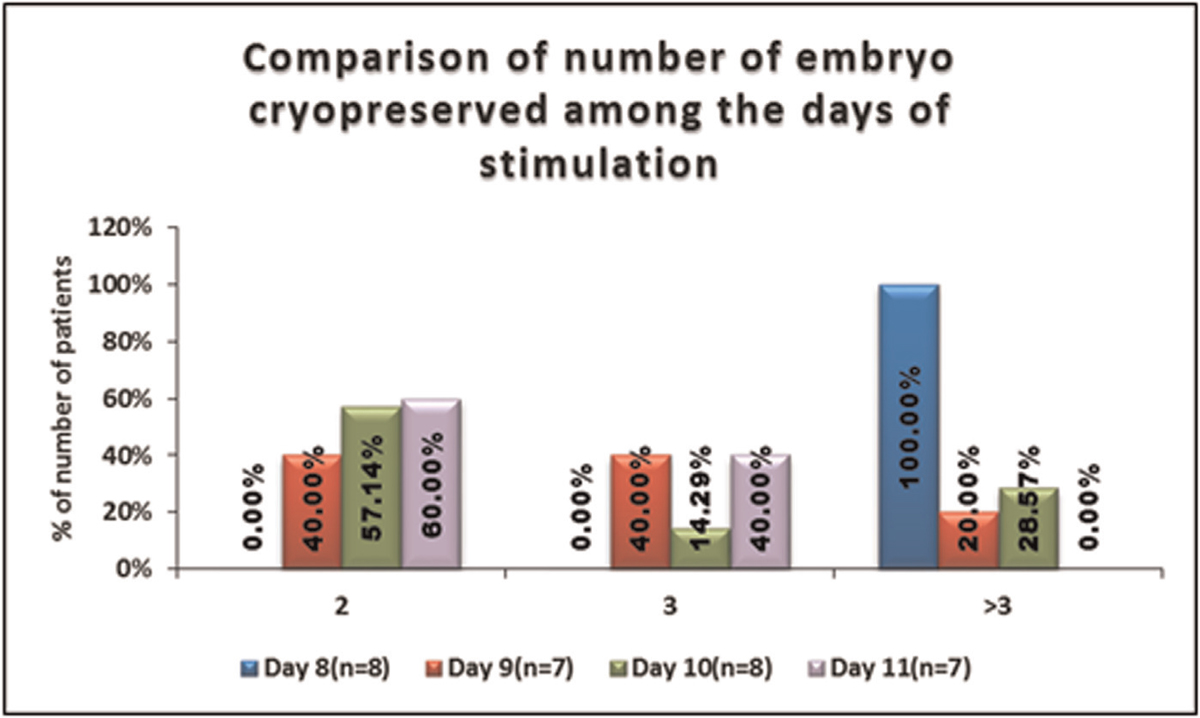
- -Comparison of the number of embryos cryopreserved amongthe days of stimulation.
No significant difference was seen in the implantation rate among days of stimulation.
It is shown in Table 13, Figures 14 and 15.


- -Comparison of the implantation rate among the days of stimulation.
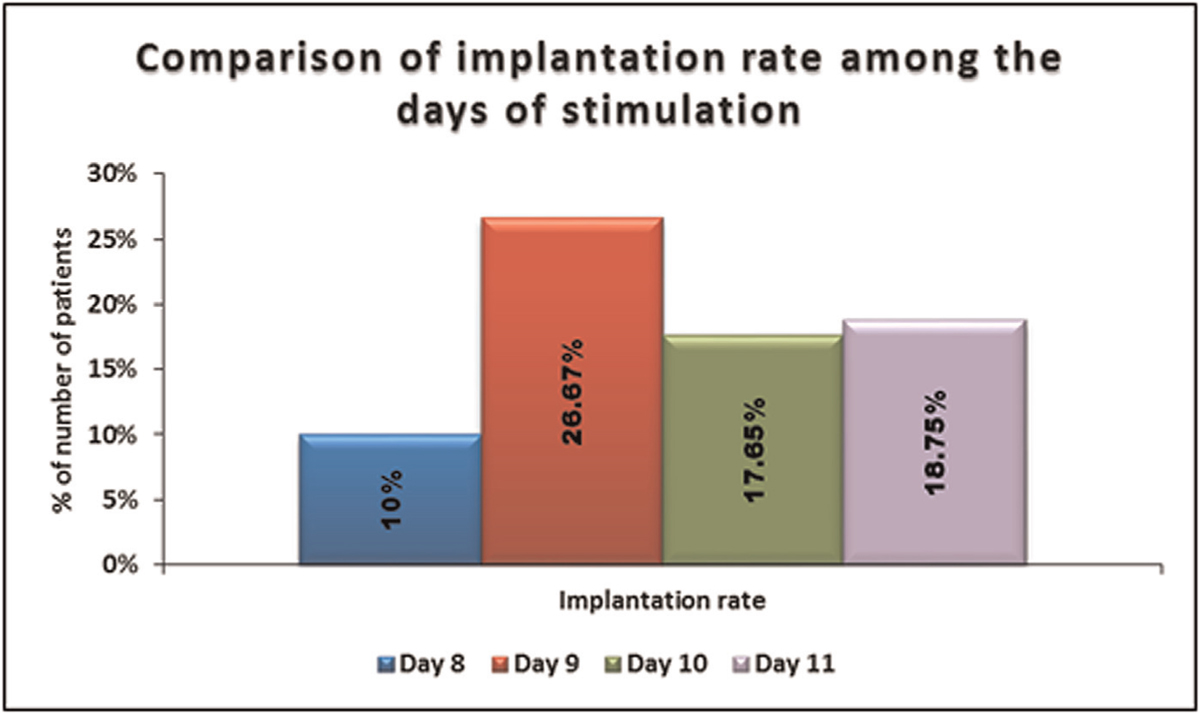
- -Comparison of implantation rate among the days of stimulation days of stimulation.
No significant difference was seen in the distribution of clinical pregnancy rate among the days of stimulation. Clinical pregnancy rate was positive in 25.00% of patients in Group A (n = 2), 28.57% of patients in Group B (n = 2), 37.50% of patients in Group C (n = 3), and 42.86% of patients in Group D (n = 3), and negative in 75.00% in Group A (n = 6), 71.43% in Group B (n = 5), 62.50% in Group C (n = 5), and 57.14% in Group D (n = 4), and with no significant difference among them.
It is shown in Table 14, Figure 16.


- -Comparison of the clinical pregnancy rate among the days of stimulation.
DISCUSSION
The findings of our study were found to be comparable to studies done by other authors. No statistically significant difference observed in the distribution of age in years among the women, when compared among the different subgroups of age viz, 24 to 29 years, 30 to 34 years, and 35 to 38 years. No statistical significant difference was found among the various types of etiologies among these women as well. No significant difference was seen in the estradiol level (pg/mL) with respect to the duration of stimulation. Mean ± standard deviation of peak estradiol level (pg/mL) in Group A was 1894.50 ± 1336.3 (n = 8), Group B was 2282.86 ± 1373.19 (n = 7), Group C was 2213.00 ± 1073.6 (n = 8), and Group D was 2213.14 ± 1107.87 (n = 7) with no significant difference among them. This was comparable to the study carried out by Ryan JM et al.,[11] where they found no significant difference in the age (years) and the estradiol values (pg/mL).
On comparing the oocytes retrieved, among the women under different sub groups based on age, no statistical significant difference was observed among women among different sub-groups of age viz 24 to 29 years, 30 to 34 years, and 35 to 38 years. However, in a similar study conducted by Alport B et al. (2011)[12] they found that the follicular number, serum estradiol levels and the oocytes retrieved were greatest when the duration of stimulation was 11 days and decreased with shorter or longer phase lengths. Also, in a similar prospective observational study, conducted by Deepmala D et al. (Deepmala D et al, 2019),[12] they observed that the follicular number and oocytes retrieved were appreciably higher in medium stimulation phase length (SPL), that is women receiving stimulation for 10 to 12 days.
Statistically significant difference was observed in gonadotropins (total dosage) among the days of stimulation. Mean ± standard deviation of gonadotropins (total dosage) in Group D (3085.71 ± 407.19) (n = 7) was highest followed by Group C (2912.5 ± 314.81) (n = 8), Group B (2389.29 ± 543.3) (n = 7) and mean ± standard deviation of total dose of gonadotropins in Group A (2093.75 ± 172.56) (n = 8) was lowest. This finding was similar to the study conducted by Ryan JM et al. (Ryan JM et al 2001-2002)[11] where, statistically significant difference was observed in gonadotropins(total dosage) required to accomplish satisfactory ovarian response among the days of stimulation, with women in Group C requiring greater doses.
In our study, no significant difference was seen in the distribution of 6-8 CELL A1, 6–8 CELL A2, 4 CELL A1, 4 CELL A2, 4 CELL C1, 4 CELL B1, 4 CELL B2, 1 × 2 CELL B1, 4 CELL C2 and 2 CELL D1 embryos among the days of stimulation, suggesting that the duration of ovarian stimulation has no influence on the embryo quality. In the studies conducted by Ata et al (2012)[13] Kan et al (2017)[14] and Labarta et al (2017),[15] they have concluded that the number of oocytes retrieved in a given cycle and the number of euploid embryos are positively related and that increasing ovarian response has no untoward effect on the quality of the embryos.
In our study, the positive pregnancy outcome was observationally higher in 10 and 11 days of stimulation but the difference was not high enough to be considered as statistically significant. This was comparable to the prospective observational study carried out by Deepmala D et al (2019),[12] where they observed that though clinical pregnancy rate (CPR) appeared higher in medium stimulation phase length (SPL), but the difference was not high enough to be considered as statistically significant. This result of the study was also comparable to a similar retrospective cohort study conducted by Alport B et al. (2011),[16] where they found no association between the duration of ovarian stimulation and the thickness of the endometrium, fertilization rate, embryo cleavage/blastocyst rate as well as the chemical or clinical pregnancy rate. The duration of ovarian stimulation the length of the stimulation phase did not influence the embryo quality as well or pregnancy result.
In our study, no associations was found between the duration of ovarian stimulation and the peak estradiol levels reached, the oocytes retrieved, implantation and pregnancy outcome. This was comparable to the study carried out by Alport B et al. (Alport B et al. 2011).[16] They concluded that though a shorter or longer duration of ovarian stimulation was linked with lower follicular number and oocytes retrieved, but it did not prognosticate the embryo development or pregnancy outcome.
In a comparable study carried out by Sarkar P et al (Sarkar P, 2017),[17] they finally suggested that although they were unable to determine whether those cycles with poor outcome in the accelerated response category, were due to lesser days of gonadotropins or due to some cause, They finally suggested that it would be advantageous to continue ovarian stimulation for at least 9 days. Also in the comparable study carried out by Deepmala D et al,[12] they concluded that optimizing stimulation phase length (SPL) between 10 and 12 days may serve as noninvasive marker for follicle/oocyte quantity but not quality. Thus, they concluded that the stimulation phase length (SPL) cannot predict IVF/ICSI outcomes.
Therefore, we concluded that the duration of ovarian stimulation should be optimized with respect to the number of mature oocytes retrieved, the fertilization rate, the embryo quality, as well as the chemical or clinical pregnancy rate, with judicious use of gonadotropins thereby decreasing the number of painful injections, the overall cost as well as avoiding or at least decreasing the risks of side effects.
CONCLUSION
In our study we concluded that the length of ovarian stimulation has little influence on quality of embryo and pregnancy outcome. We found that the duration of ovarian stimulation cannot predict IVF/ICSI outcomes. The limitation of our study was the small time frame and lesser number of women recruited for the study. The conclusion drawn from our study needs to be confirmed by larger studies. Hence, further trials and researches are needed to prove the foresaid conclusion.
Financial support and sponsorship
Nil.
Conflicts of interest
There are no conflicts of interest.
REFERENCES
- Lifestyle factors and reproductive health: taking control of your fertility. Reprod Biol Endocrinol. 2013;11:66.
- [Google Scholar]
- Prevalence and correlates of primary infertility among young women in Mysore, India. Indian J Med Res. 2011;134:440-6.
- [Google Scholar]
- Trends of infertility and childlessness in India: findings from NFHS data. Facts Views Vis Obgyn. 2010;2:131-8.
- [Google Scholar]
- 2013. Assisted reproductive technology success rates: National summary andfertility clinic reports [online]. Date of Access/retrieval 20.07.201 URL URL:http://www.cdc.gov/ART/PDF/ART2013_National_Summary_report.pdf
- Follicular development and hormone concentrations following recombinant FSH administration for anovulation associated with polycystic ovarian syndrome: prospective, randomized comparison between low-dose step-up and modified step-down regimens. Human Reprod. 2001;16:652-56.
- [Google Scholar]
- Gonadotropinreleasing hormone agonist use in assisted reproduction cycles: the influence of long and short regimens on pregnancy rates. Fertil Steril. 1999;72:83-90.
- [Google Scholar]
- Factors that affect outcome of in-vitro fertilisation treatment. Lancet. 1996;348:1402-6.
- [Google Scholar]
- Adequacy of sample size in health studies/Stanley Lemeshow. [et al.]. Chichester: Wiley; 1990. Available from: https://apps.who.int/iris/handle/10665/41607
- Impact of duration and dose of gonadotropins on IVF outcome. Reprod Biomed Online. 2006;13:645-50.
- [Google Scholar]
- Effect of stimulation phase length (SPL) on IVF/ICSI outcomes: a prospective study. Fertil Sci Res. 2019;6:133-39.
- [Google Scholar]
- Array CGH analysis shows that aneuploidy is not related to the number of embryos generated. Reprod Biomed Online. 2012;24:614-20.
- [Google Scholar]
- Is more better ? A higher oocyte yield associated with more day 3 euploid embryos Human Reprod. 2017;32:i436.
- [Google Scholar]
- A higher ovarian response after stimulation for IVF is related to a higher number of euploid embryos. Biomed Res Int 2017 20175637923
- [Google Scholar]
- Does the ovarian stimulation phase length predict in vitro fertilization outcomes? Int J Fertil Steril. 2011;5:134-41.
- [Google Scholar]
- Duration of gonadotropin stimulation is predictive of IVF outcome. Fertil Steril. 2019;108:e231.
- [Google Scholar]